Medicaid Waiver Programs by State
Over 300 state programs now help millions afford home care instead of institutions.
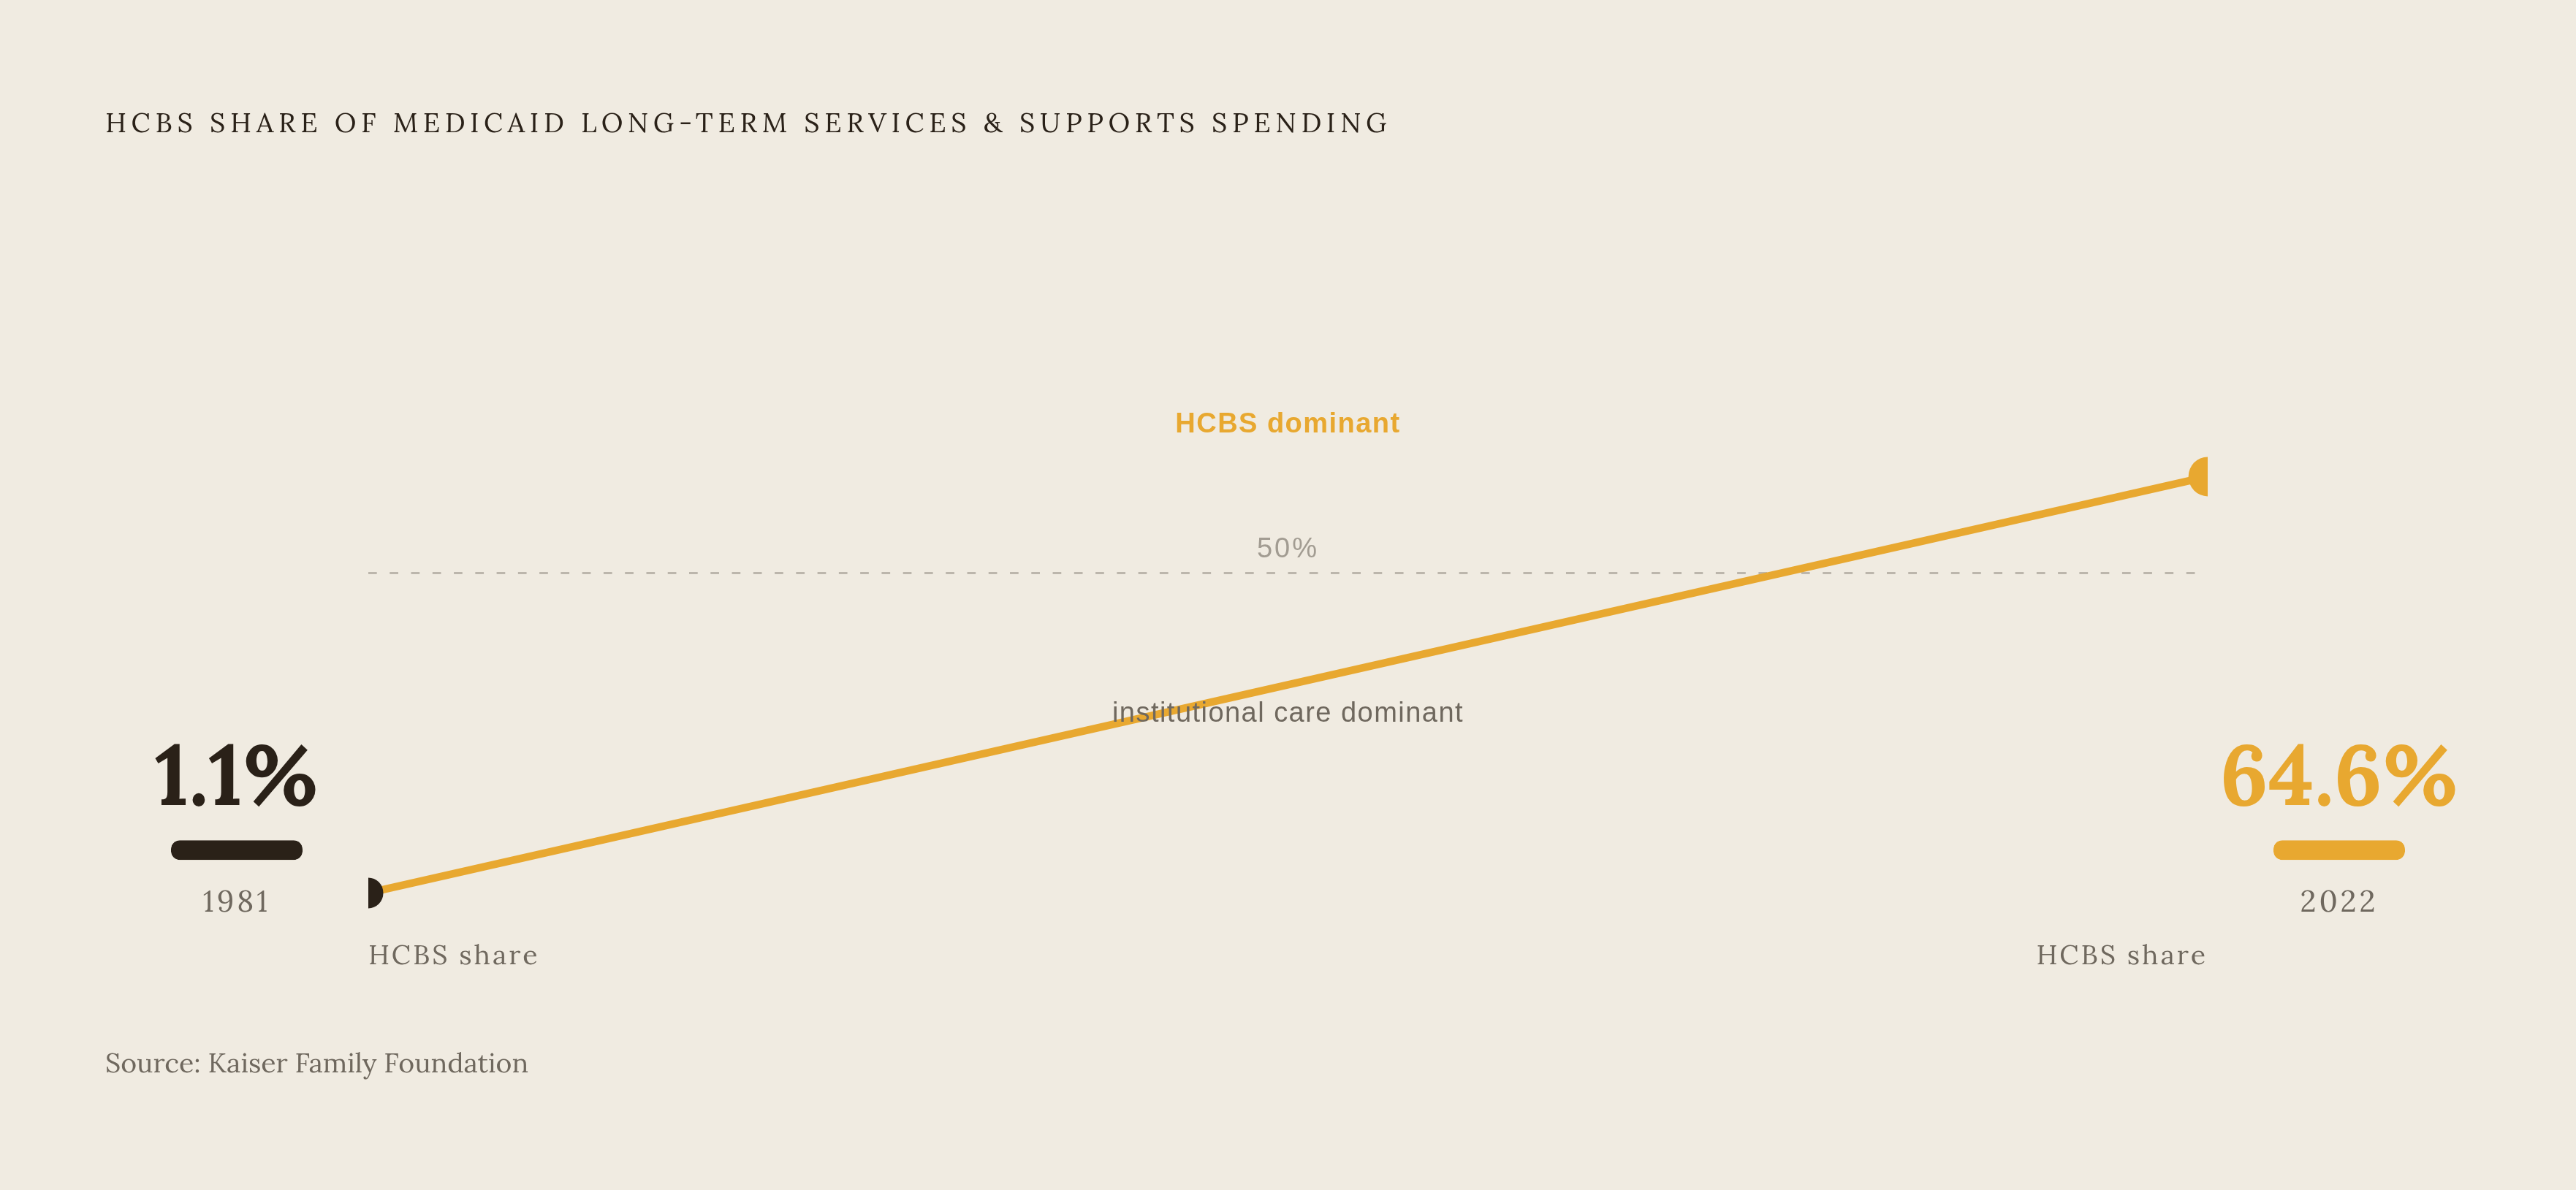
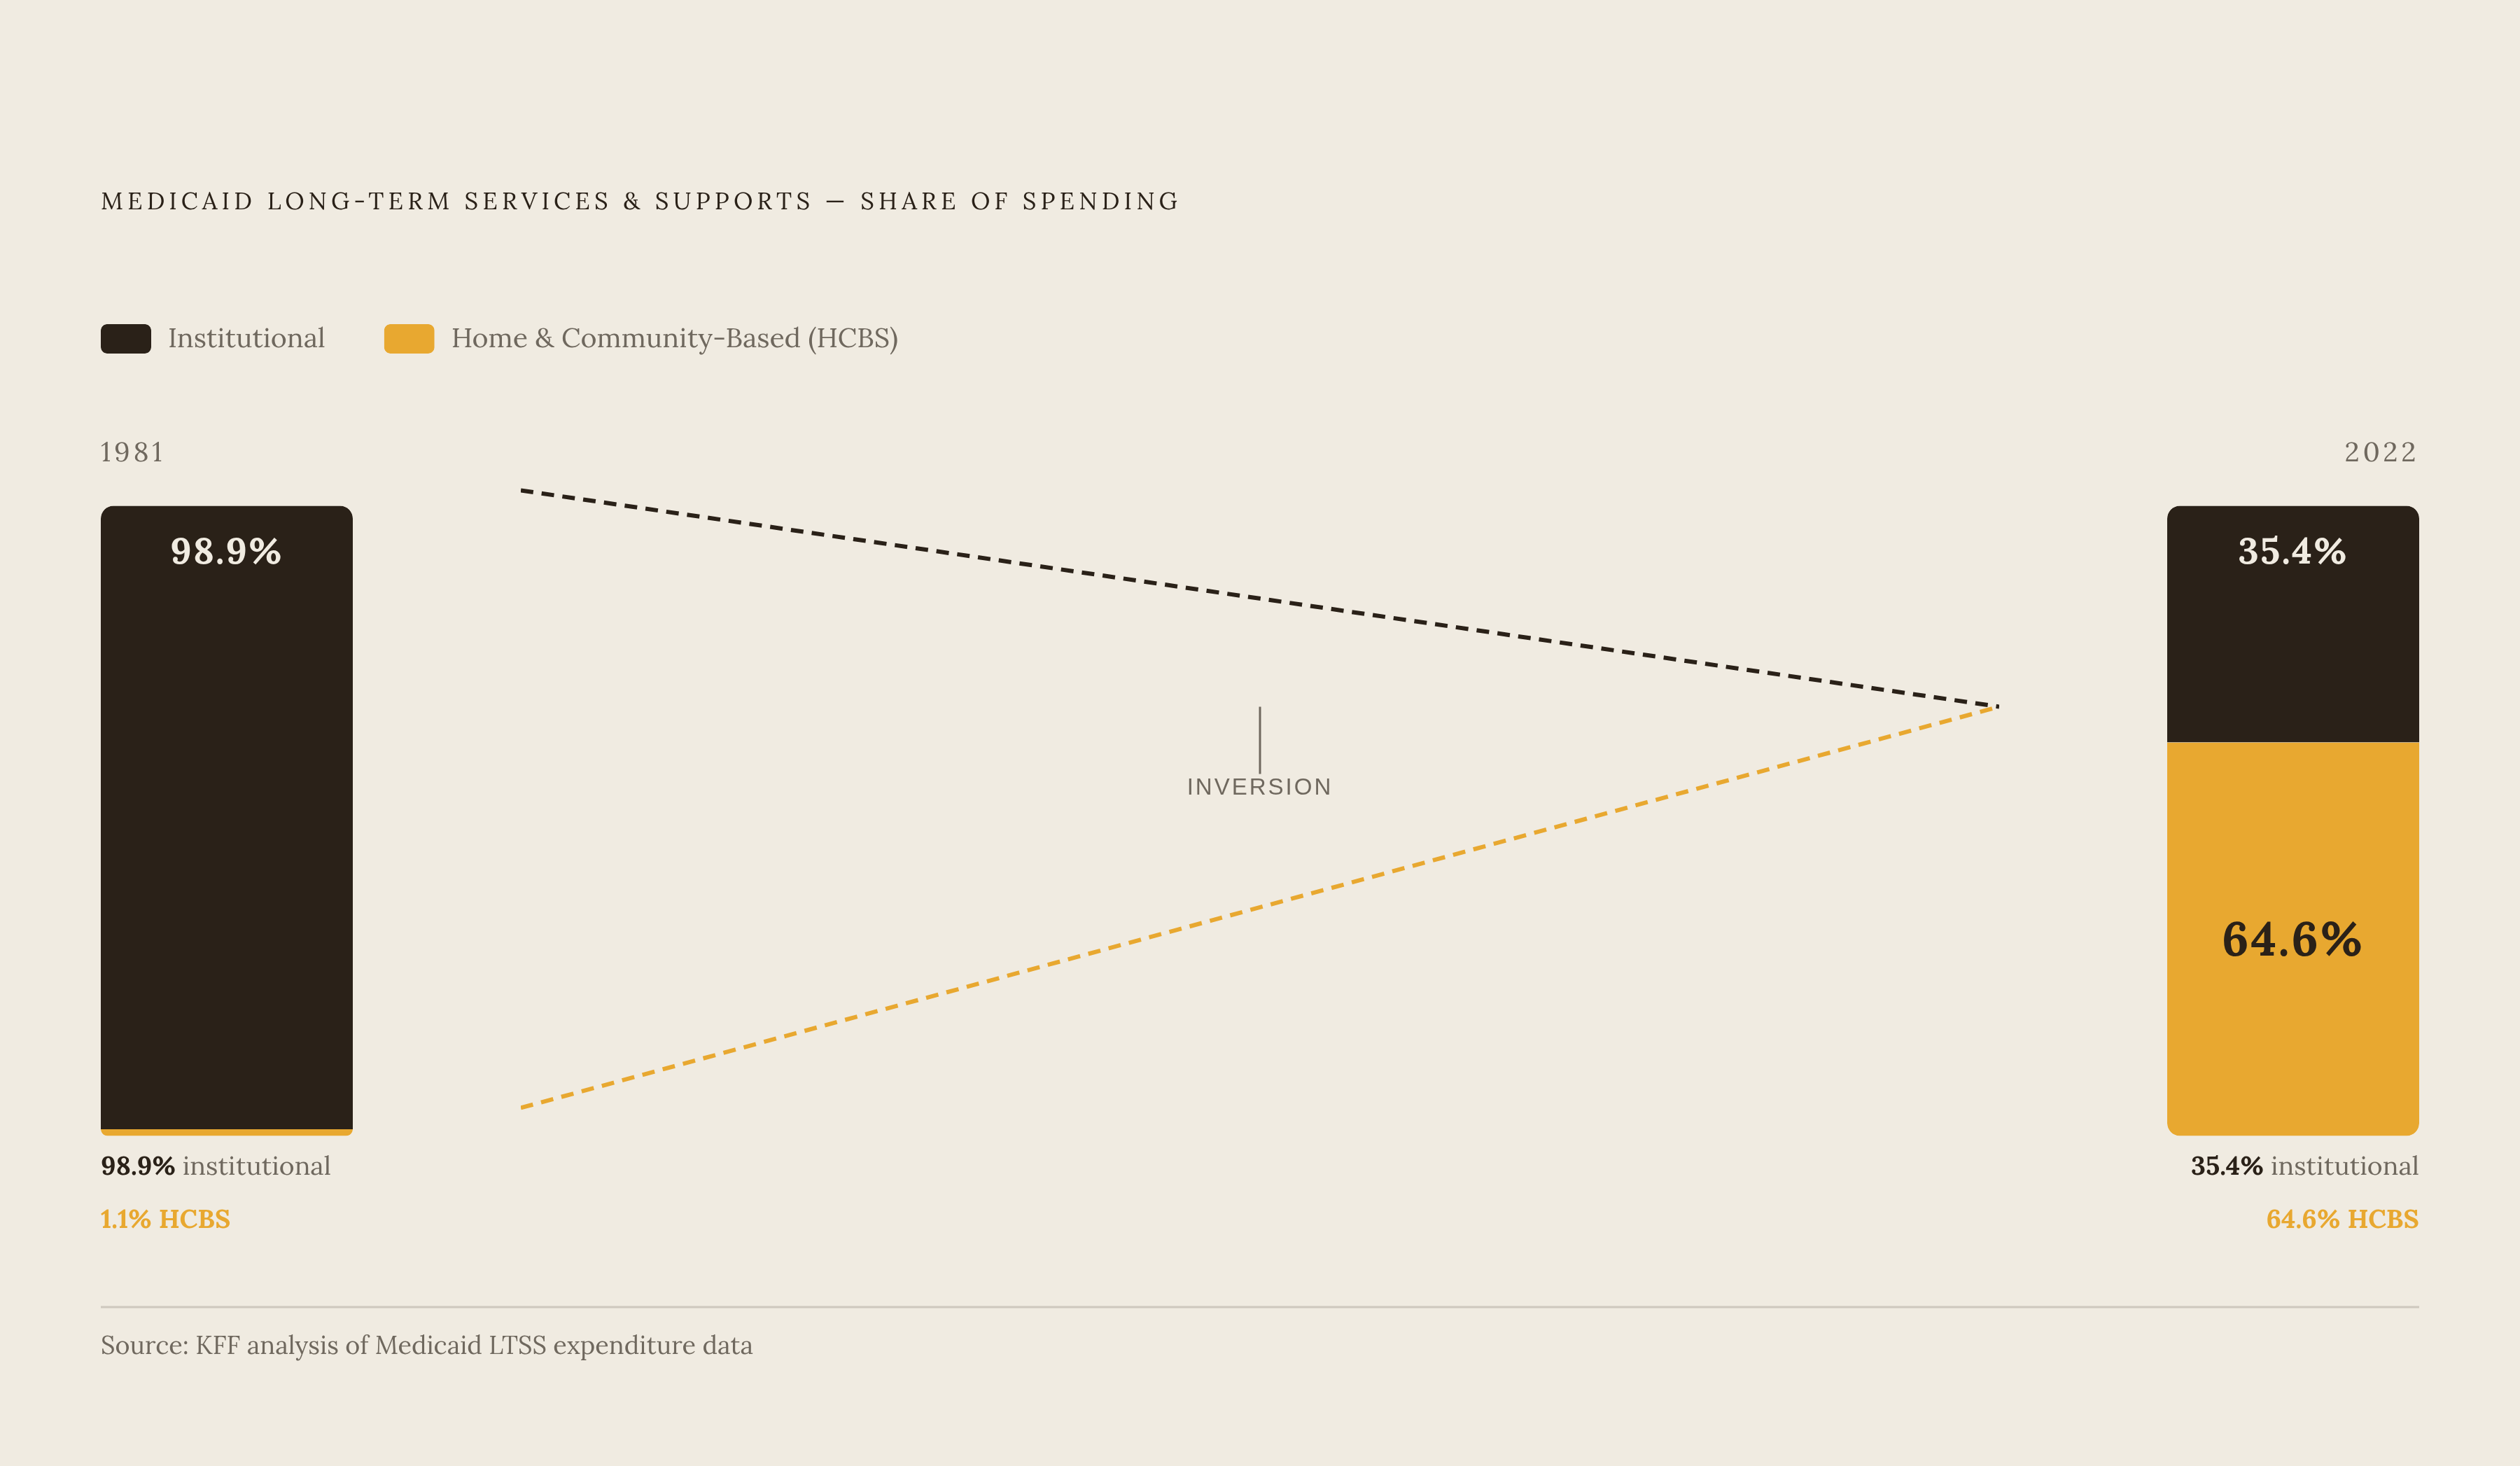
The scale of this shift still catches me off guard when I look at the numbers side by side. In 1981, Home and Community-Based Services accounted for 1.1% of Medicaid long-term services and supports spending. By 2022, that figure had climbed to 64.6%, per data tracked by the Kaiser Family Foundation. Nothing about that trajectory was inevitable. It happened through incremental legislative action, court settlements, and advocacy campaigns that most Americans never followed closely, accumulating over decades into something that now quietly shapes the lives of millions of families.
As of 2025, states operate over 300 distinct home care programs. The majority, 259 of them, run through 1915(c) waivers; 15 run through 1115 demonstrations. Forty-six states and the District of Columbia operate at least one 1915(c) waiver, comprising 267 CMS-approved waivers in total, according to KFF's 23rd annual survey of state Medicaid HCBS officials. Over 5 million people receive Medicaid-covered home care services annually.
In calendar year 2021, Medicaid spent $82.5 billion on HCBS compared to approximately $66.6 billion on institutional care. The per-user figures are worth sitting with: HCBS spending ran more than $32,000 per user versus more than $45,000 for institutional long-term care. That gap has driven the policy rationale behind waivers for decades. CMS generally approves waivers, in part, because the arithmetic is favorable.
What that growth also produced is a system of staggering complexity, and this is the part that rarely makes the official talking points. More programs exist than most families realize. Navigating them has become correspondingly harder. A system spanning hundreds of distinct programs across 46 states, each with its own enrollment caps, eligibility criteria, and waiting lists, rewards those with institutional knowledge and punishes everyone else.
The Two Populations Waivers Most Commonly Serve, and Why That Shapes What Your State Offers
The two most common waiver targets, by state coverage, are people with intellectual or developmental disabilities, served in 48 states, and older adults and people with physical disabilities, served in 46 states, per the KFF 2025 survey. These populations dominate program design and political attention, but they are not equivalent in cost structure, and that asymmetry has real consequences for how your state allocates resources.
People with I/DD and autism spectrum disorder account for 52.5% of HCBS spending while comprising only 30.7% of HCBS users in CY 2021. That concentration of per-person cost shapes how states allocate waiver slots, how long waiting lists grow, and which advocacy communities command the most influence over state budgets. When shortfalls arrive, these dynamics determine whose access gets cut first.
Waivers also exist in various states for people with traumatic brain injury, children with complex medical needs, people with mental illness or substance use disorders, and medically fragile or technology-dependent individuals. Most states run multiple waivers simultaneously, each capped at a set enrollment number. A person may qualify for one waiver but not another, or face dramatically different wait times depending on which population category applies. That is not a design flaw so much as an artifact of the legislative compromises and budget constraints different states have negotiated at different points in time. Understanding the distinction between programs is essential before making the first call.
The delivery model compounds this variation. Twenty-six states now route 1915(c) waiver benefits through managed care plans, but only 8 of the 47 states responding to the KFF survey that operate I/DD waivers use managed care for that population. The enrollment experience, how you apply, which providers you can use, how disputes get resolved, differs substantially by both state and population.
What Waiver Programs Typically Cover, and the Services Families Most Often Don't Know to Ask For
The core services authorized under 1915(c) waivers include personal care and home health aide services, case management and care coordination, adult day programs, habilitation services for skill-building among people with disabilities, respite care for family caregivers, and homemaker services covering meal preparation, cleaning, and errands. Families who have been navigating this system for years tend to know this list. The categories below it are where the real knowledge gaps live.
Respite care deserves particular attention because it is consistently the least-publicized benefit in this system, and the consequences of that silence are not abstract. A family caregiver who has been providing round-the-clock support for years may have no idea that a waiver can fund temporary professional relief so they can rest, travel, or simply work a full week without crisis. The benefit exists because caregiver burnout is both a health outcome and a cost driver the system has a rational interest in preventing. States that underpublicize it are, in practice, underwriting the very burnout they would otherwise spend money treating.
Several other categories are routinely overlooked in ways that have material consequences. Caregiver compensation programs, available in a meaningful number of states, allow family members, including adult children and in some states spouses, to be paid as personal care providers through the waiver. Assistive technology and home modification funding can finance ramps, grab bars, stair lifts, and communication devices. Supported employment and day services reach working-age adults with disabilities who are not on a nursing-facility trajectory. Transportation to medical appointments is often available but rarely requested, in part because no one mentions it at intake.
State variation is real and consequential. Not every state covers every service category, and optional add-ons within a waiver mean two people nominally enrolled in the same program in different states may receive quite different benefits. Medicaid pays for nearly 70% of all home care spending in the United States, and nearly all of it flows through optional state services. Waiver design decisions made in state capitals, usually without public attention, carry outsized consequences for individual families.
Income and Asset Rules That Determine Who Can Get In, and the Thresholds Most People Don't Know Exist
HCBS waivers use different income rules than standard Medicaid, and in most cases those rules are more permissive than families expect. The federal cap for Medicaid home care income eligibility sits at 300% of the Supplemental Security Income limit, which in 2025 equals $2,901 per month, per the KFF 2025 survey. Asset limits are typically set at $2,000 per individual, though some states have modified this threshold. Most states also allow higher income thresholds for waiver eligibility than for basic Medicaid coverage.
Functional eligibility runs parallel to financial eligibility as a separate and equally binding requirement. Most waivers require meeting a level-of-care threshold, typically a nursing-facility level of need, regardless of income. Financial eligibility is necessary but not sufficient.
Three misconceptions surface often enough to be worth addressing directly. First: "We own our home, so we won't qualify." In most states, the primary residence is excluded from asset calculations. Second: "My income is too high." Waiver income thresholds are frequently higher than general Medicaid thresholds, and spend-down rules or special income rules may shift the math significantly. Third: "My family member isn't elderly, so there's no waiver for them." Waivers for working-age adults with disabilities exist across nearly all states. Age is one variable among several, not a disqualifying condition in itself.
Even when every eligibility criterion is met, enrollment is not guaranteed. Waivers cap participation. That is where the waitlist problem begins.
The Waitlist Crisis: Why Eligibility and Access Are Two Very Different Things
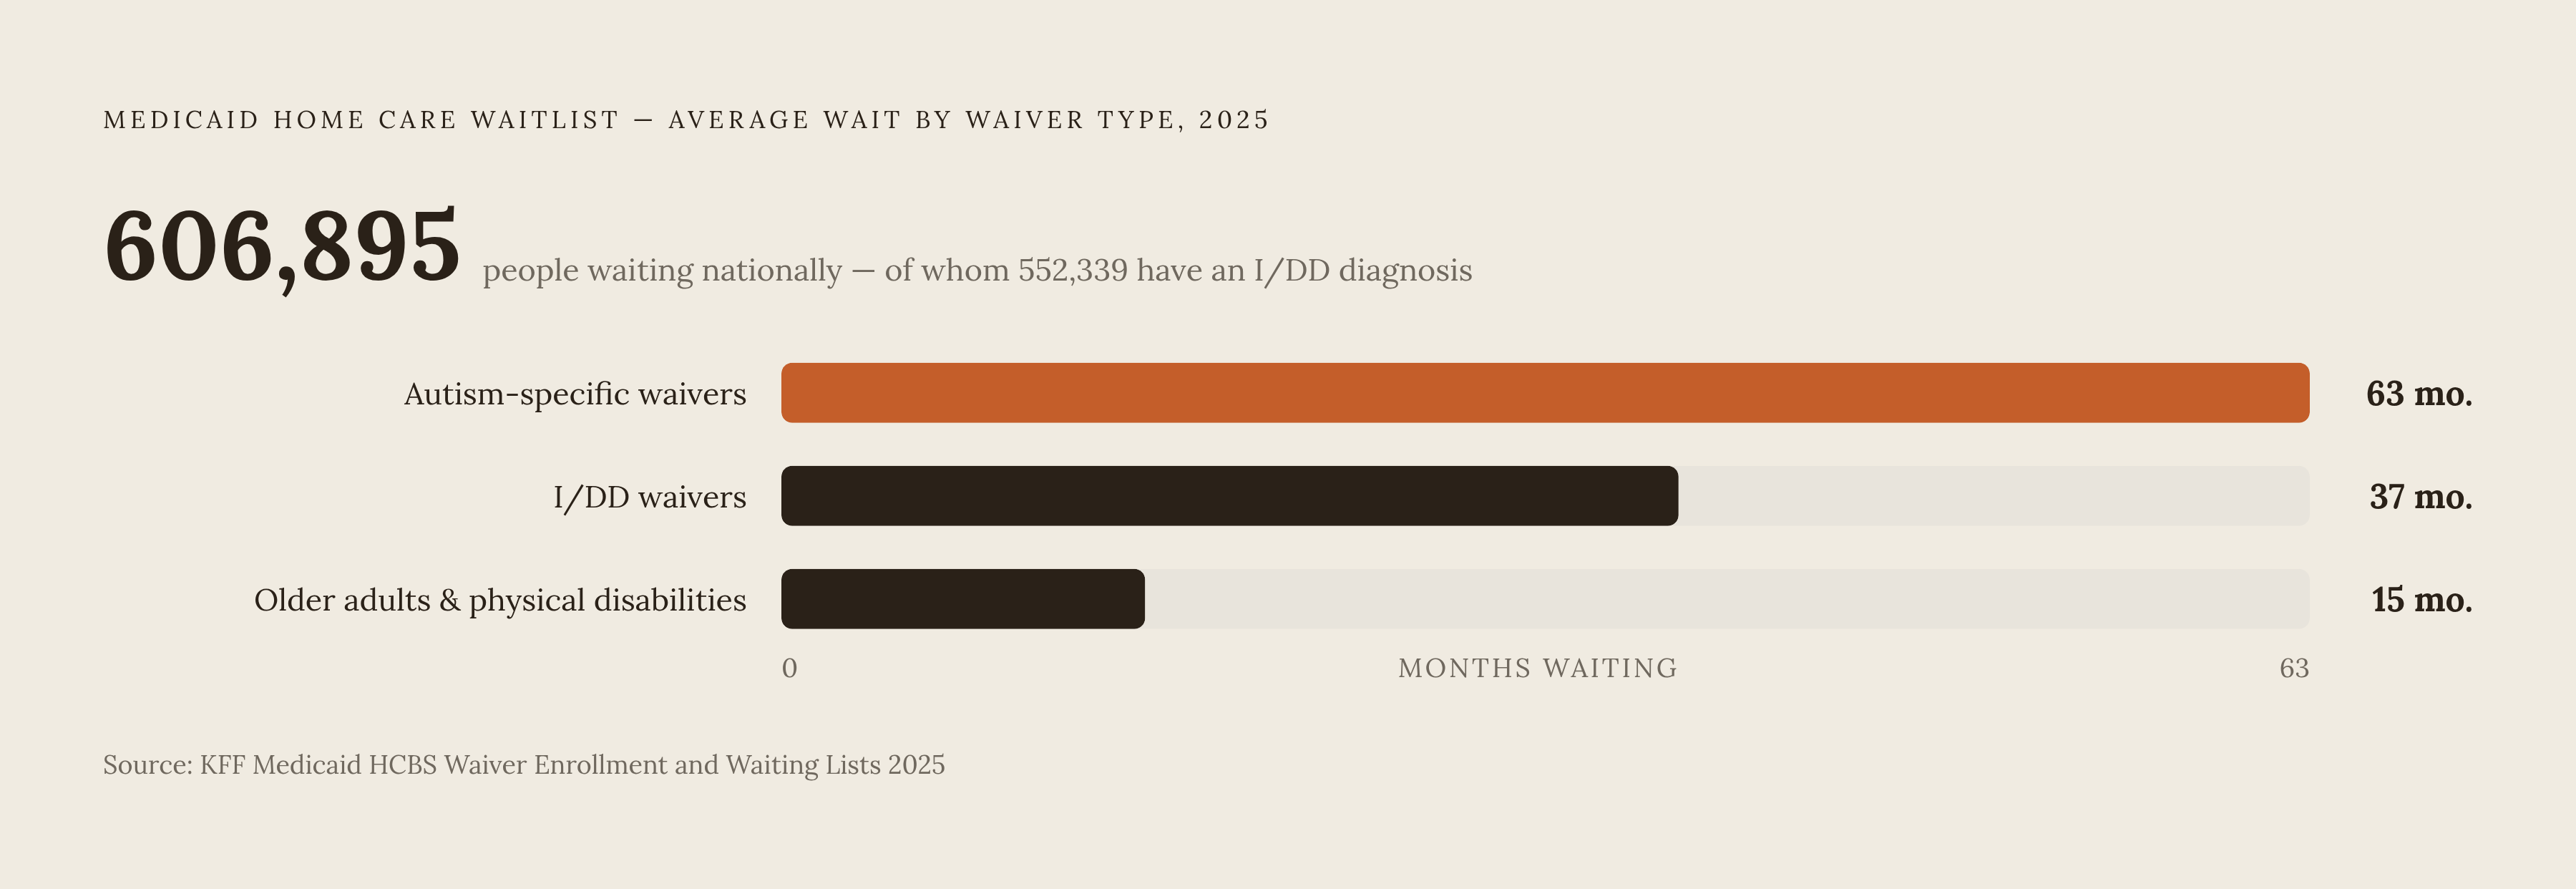
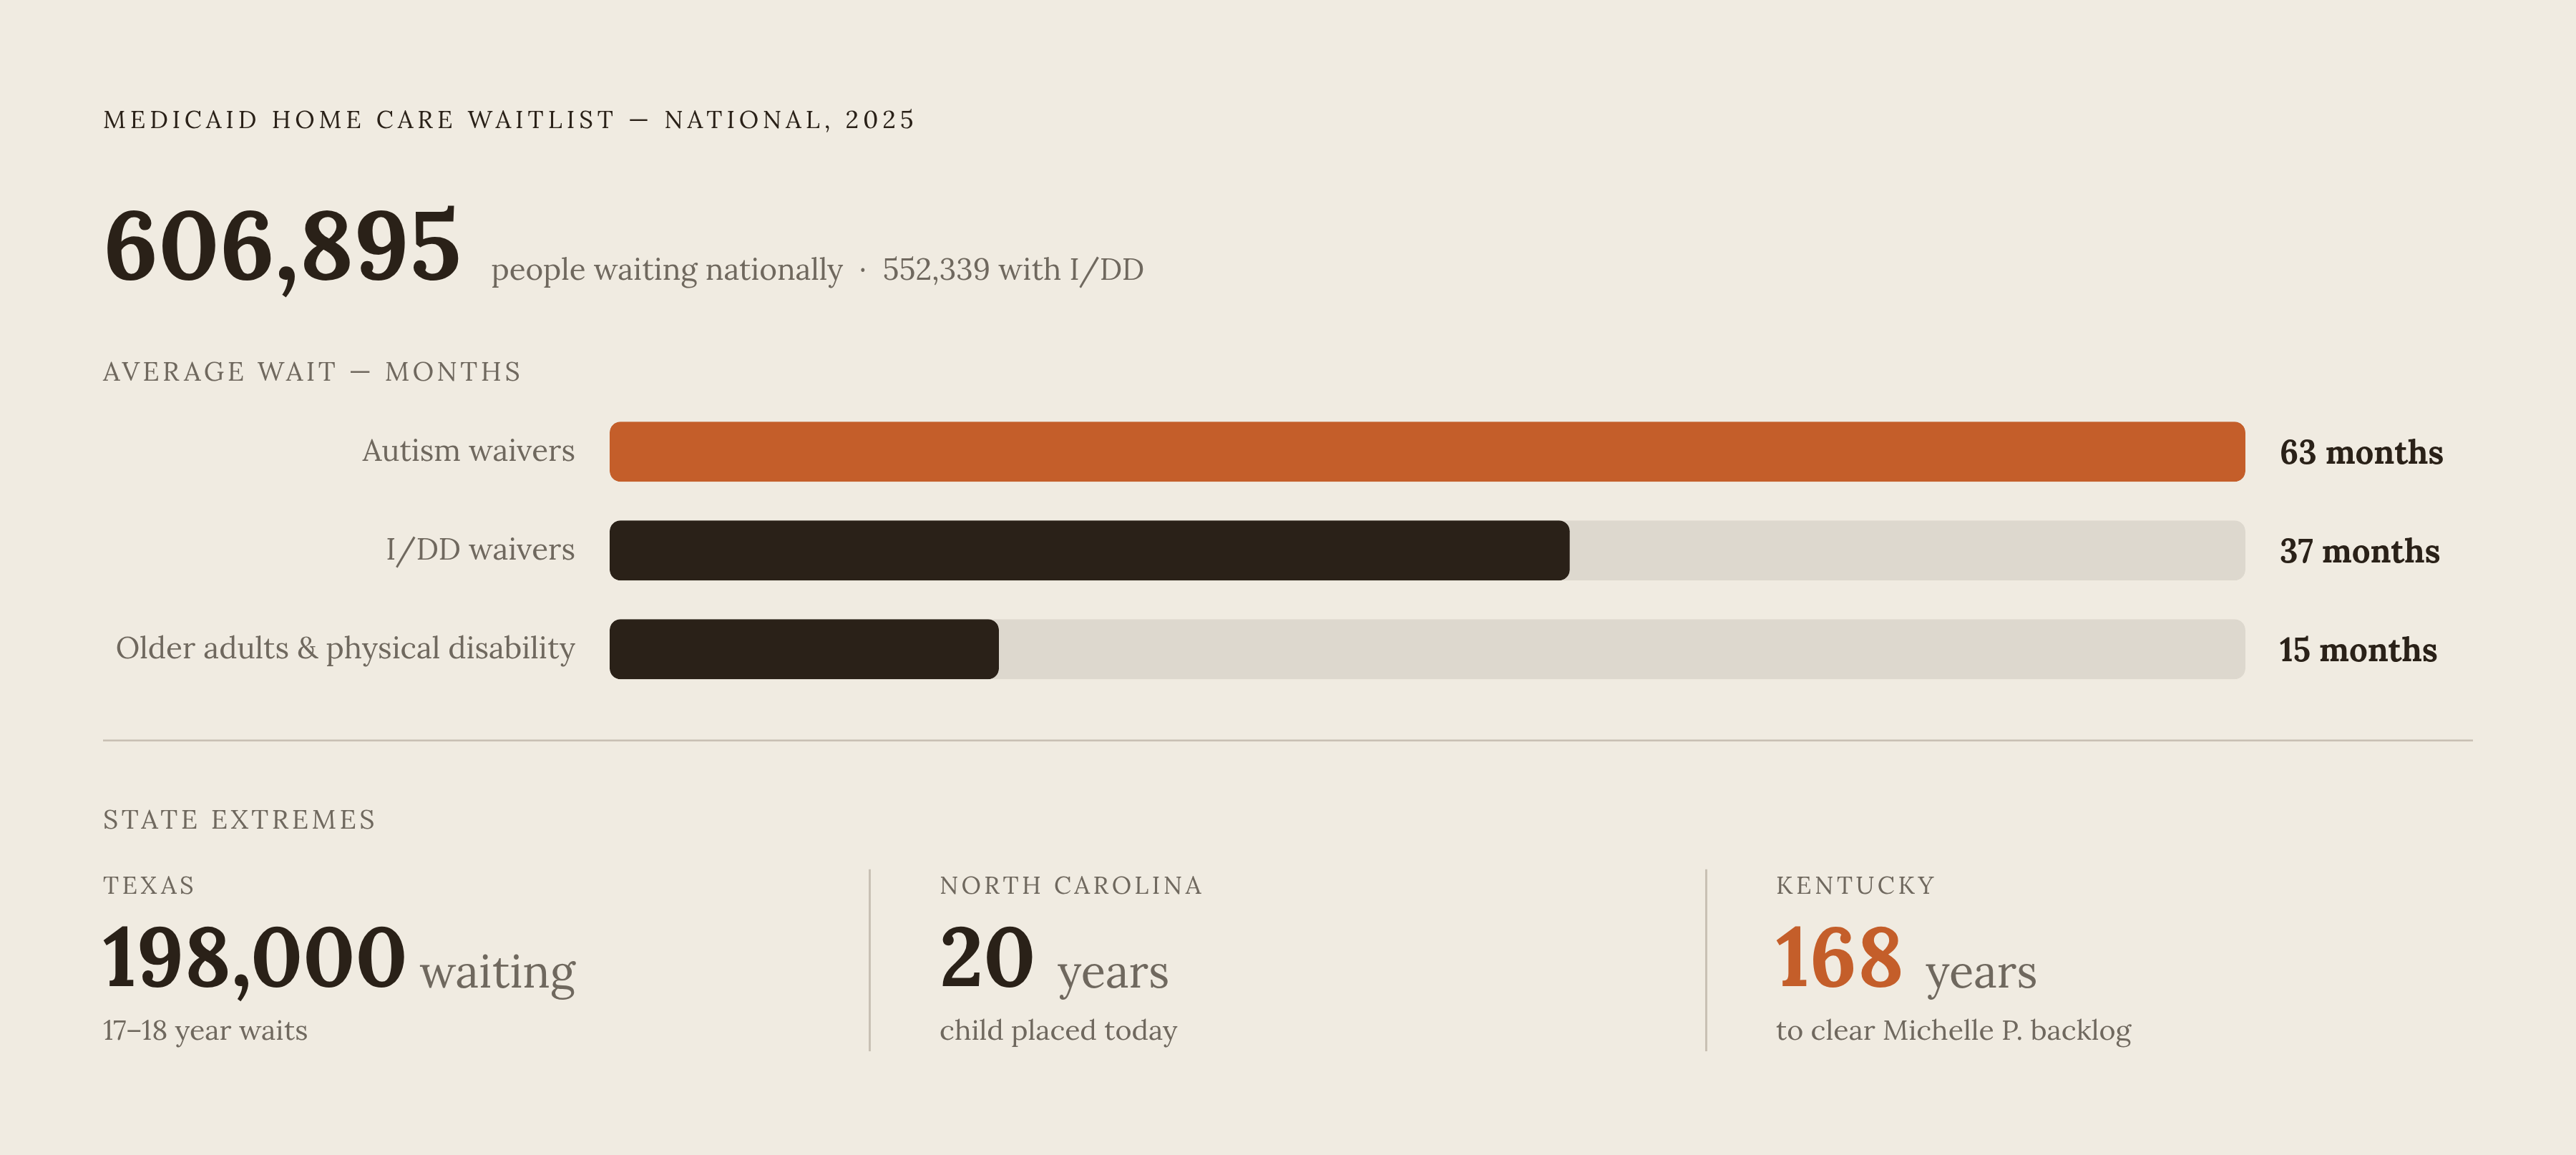
More than 606,895 people with disabilities are on Medicaid home care waiting lists nationally in 2025, according to KFF's survey. Of those, 552,339 have an intellectual or developmental disability. Forty-one states maintain waiting lists or interest lists, a count that has held roughly steady since 2016, with at least half a million people waiting in every year since. In 2025, 29 states reported an increase in waiting list numbers, and 12 states reported at least one new waiting list.
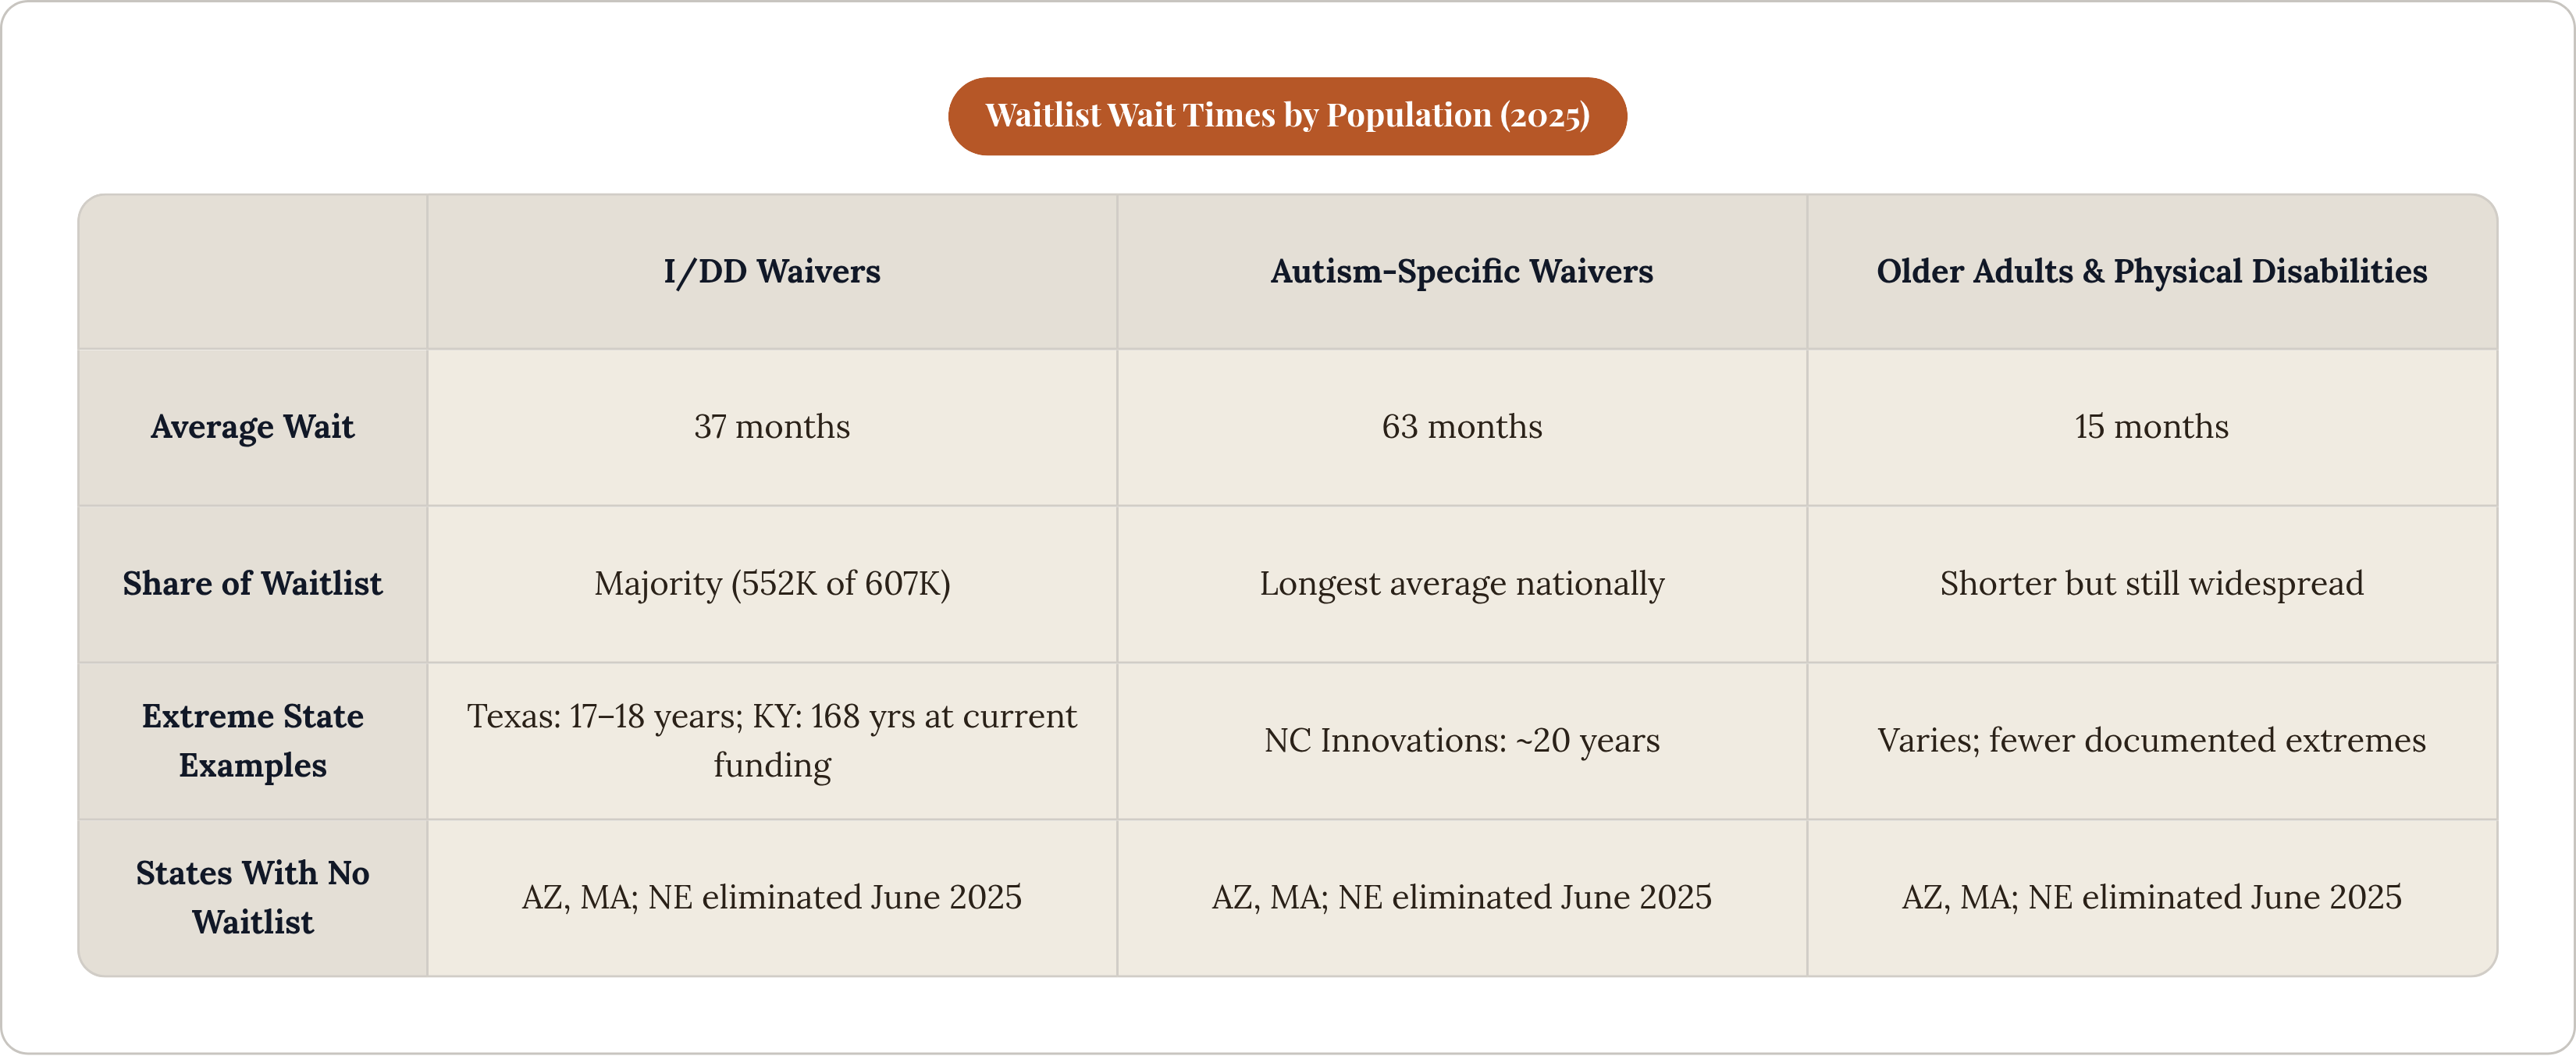
Wait times vary dramatically by population. The average for I/DD waivers is 37 months. For older adults and people with physical disabilities, it drops to 15 months. For autism-specific waivers, it rises to 63 months.
State-level extremes make the severity concrete. Texas has more than 198,000 people on waiver interest lists; the wait for Home and Community-Based Services runs 17 to 18 years. Families in North Carolina placing a child on the Innovations Waiver list today may wait 20 years. In Kentucky, at current funding levels, it would take 168 years to serve everyone on the Michelle P. Waiver. These are not rounding errors. They are the arithmetic of systematic underfunding.
A critical data quality caveat applies here. Six states, Florida, Iowa, Oklahoma, Oregon, South Carolina, and Texas, do not screen for eligibility before placing people on interest lists. Their numbers are inflated, because not everyone recorded would ultimately qualify. These six states account for more than half of all people waiting nationally. Anyone interpreting their state's numbers should find out whether pre-placement screening occurs before drawing conclusions.
Arizona and Massachusetts operate with no waitlists. Nebraska eliminated its entire waitlist in June 2025. These are not flukes of geography or demography. They are the product of sustained political will and funding commitment. The crisis exists where it exists because of policy and funding choices, and that accountability is worth sitting with.
For families, the practical implication is blunt: get on the list as early as possible, even if services are not needed immediately. In most states, date of application determines position in the queue. Waiting until a crisis arrives to apply is among the most costly mistakes a family can make, measured in years rather than dollars.
How Major States Have Designed Their Waiver Programs Differently, and What That Means in Practice
California's approach, channeled through Medi-Cal and the CalAIM initiative, represents a population-health, managed-care-integrated model. CalAIM is a multiyear 1115 demonstration approved by CMS in December 2021 and running through December 2026. It focuses on integrated care across physical health, behavioral health, and social services, a broader frame than traditional standalone waivers. A separate 1115 demonstration, BH-CONNECT, approved in January 2025 through December 2029, expands community-based behavioral health services and addresses social determinants of health. California's system is broader in scope than most; it is also considerably harder to navigate.
New York's 1115 waiver includes a a multibillion-dollar statewide investment over three years through March 2027. A waiver amendment approved by CMS in 2024 created Health Equity Regional Organizations, known as HEROs, designed to integrate social services and health care delivery with an explicit focus on structural equity. New York is using waiver authority not merely to fund services but to redesign the delivery infrastructure around them.
Georgia occupies a different position. It is the only state with an active Medicaid work requirement waiver, a fundamentally different eligibility design that conditions coverage on employment or community engagement. This demonstrates that 1115 waivers can be used to restrict access as readily as to expand it. For anyone in a state where similar proposals are circulating, Georgia's program is a live data point, not a hypothetical.
Texas and North Carolina, already discussed in the context of waiting lists, are worth cross-referencing here. Both states operate waiver programs while simultaneously maintaining some of the most severe access backlogs in the country. Operating a waiver and actually providing access are different things, and treating them as synonymous is a mistake families in those states pay for concretely.
What these examples collectively reveal is that states deploy identical federal waiver authority in service of very different policy goals: expanding care coordination, testing equity infrastructure, conditioning eligibility on behavior, or simply underfunding enrollment. Understanding your state's underlying policy orientation matters for knowing what to realistically expect and how to engage the system when it resists.
How to Find Out Which Waivers Your State Operates, and Whether You or a Family Member Qualifies
The authoritative federal index of all active waivers by state is the Medicaid.gov demonstration and waiver list. CMS also maintains a database of state Medicaid plans and waivers. KFF's 1115 waiver tracker is particularly useful for monitoring pending and approved demonstration waivers with state-by-state status. State Medicaid agency websites, despite their frequent fragmentation, remain the first place to find a specific state's waiver names, enrollment contacts, and waiting list procedures.
When researching your state, the questions that matter most are: which waiver programs exist for your family member's specific diagnosis or age group; whether the state maintains a waitlist and what the current estimated wait is; how to formally apply or get on an interest list and how to document the application date; and whether the state uses managed care for waiver delivery, since that determines which providers are available.
State Medicaid websites are often counterintuitive and inconsistently maintained; program names routinely bear little relationship to what programs actually do; eligibility rules across multiple waivers are difficult to compare without guidance. For families who are unsure where to start, state long-term care ombudsmen and SHIP counselors can assist with waiver navigation at no cost. The resource exists in most states and is substantially underused.
Four actions are worth prioritizing. Apply or request waitlist placement as soon as possible, even before services feel urgently necessary. Request a functional needs assessment if one is required rather than waiting for the state to initiate it. Ask specifically about caregiver compensation options within any waiver under consideration, since this benefit is consistently underpublicized and frequently missed. Confirm whether your state screens for eligibility before waitlist placement, because the answer changes how much weight to give your position in the queue.
The information needed to navigate this system exists. Whether families find it before circumstances force the issue is a different question entirely, and one that depends less on the system than on who happens to mention it first.